
<Note: I sincerly apologize for all the spelling and gramatical mistakes, and for nonsense as well. >
Why is your skin so tanned?
A strategic Location for plantations
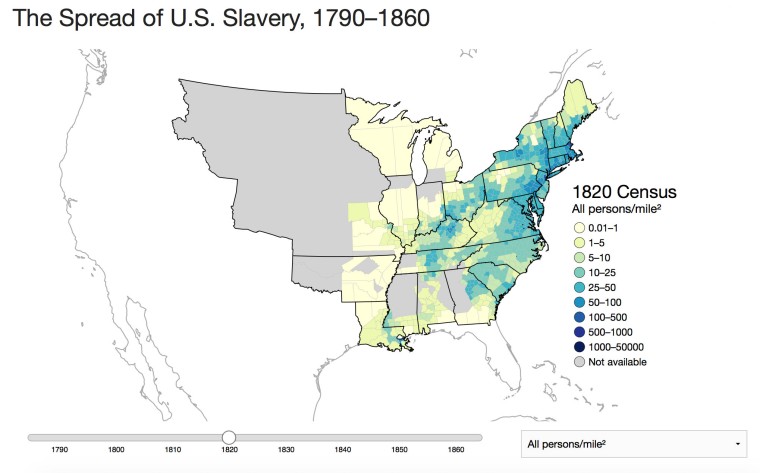
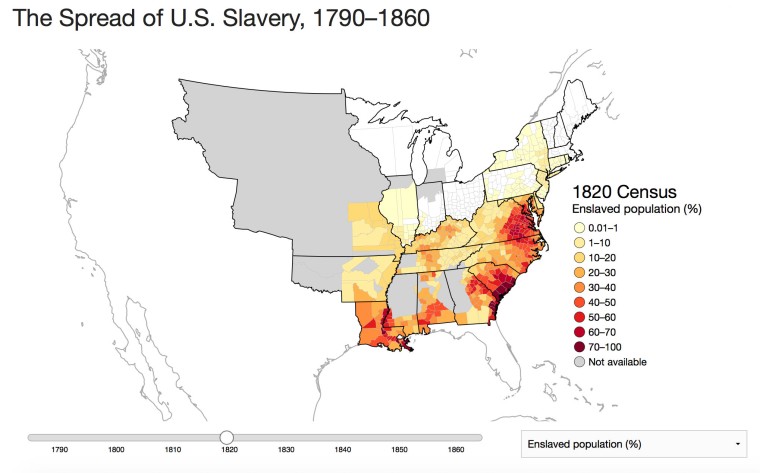
Situated down south, at the Mississipi delta, The city occupies a strategic location. During the 18th century, the American population was concentrated in the north-est, around New York and D.C. After the Louisiana purchase, US population has spread down south. In 1820 (actual) Louisiana is the most populated states in the south. The port is in charge of all North/south exchange along the Mississippi or international exchange, sailing on the Atlantic. Taking into consideration the absence of other transportation mean, I let you imagine how much valuable New Orleans was (Fig2).
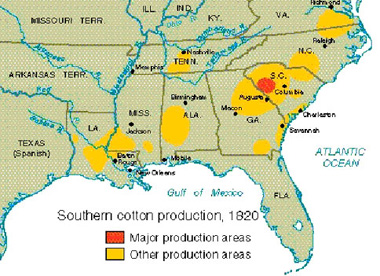
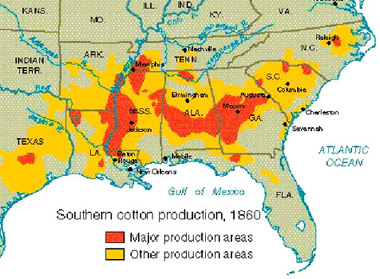
At the same time, cotton became ”King Cotton” with the invention of the ”gin cotton” in 1793 (engine fifty times more efficient than a worker). Since we now had a way to proceed more cotton than we had, more cotton was needed. Plantation multiplied exponentially, jumping from approximately 13 000 bales in 1792 to more than 5 million bales by 1860 (Fig3).
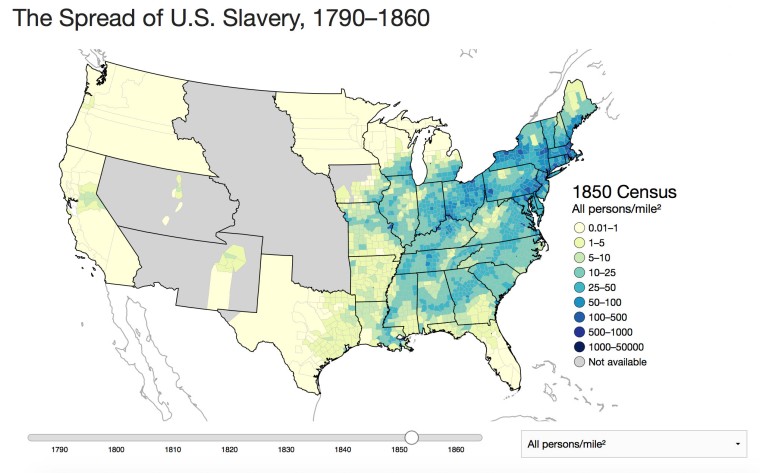
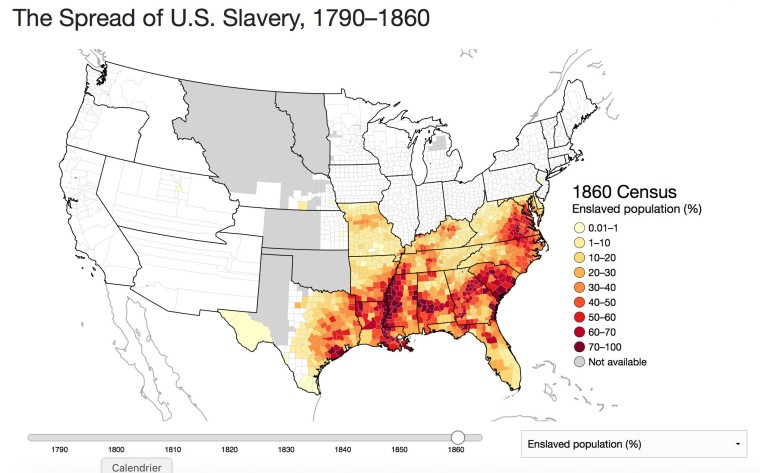
The more there was cotton to be picked the more « workers » were needed to pick it. Off course, you want to get the most out of it and make the money rain. The maximum yield is reached when the labor is free if you see what I mean. . . The number of slaves rose from 700 000 in 1790 to nearly 4 million by 1860. Human trafficking got more intense, import/export of goods as well. New Orleans became the wealthiest city in the USA, 590-foot yacht sailing on tears, blood, and sweat. In 1860, enslaved people could represent up to 70%-80% of the population, and so all the way down the Mississippi river (Fig4).
One specificity of Louisiana was the amount of free African-American. Country wise, most of them were living in the north-est of the country in big cities like New York or D.C. If you consider the south only, almost 100% of them were living in Louisiana (Fig5).
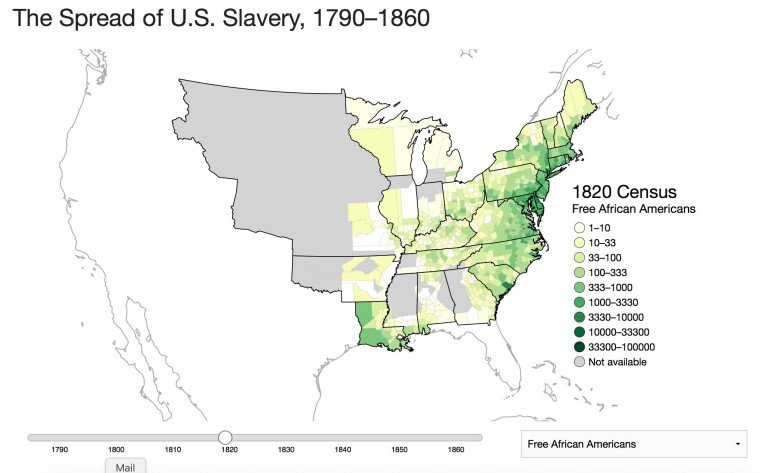
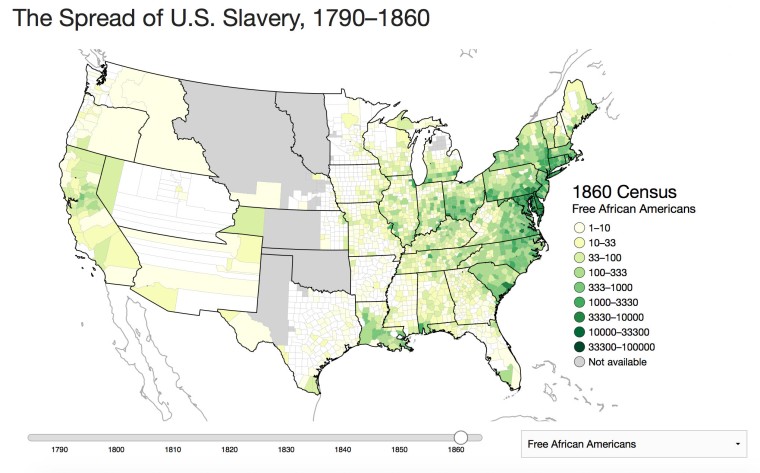
Most of them were freed during the French or Spanish occupation. despite the life condition of slaves in the surrounding, they thrived, explaining how African cultures could equally mix with the others, much more than in other cities, giving birth, not to the Black-American culture we know today, but to the Creole one.
In 1861 start the secession war. In 1862 New Orleans was already occupied by the unionist. At the end of the war, all the slaved were freed all over the country but segregation was and still is a wall to tear down .
Today, 61% of New Orleans population is black. It would be easy to correlate these figures with the 70% of enslaved population in 1860. It would be easy, yes, but it would be absolutely wrong. If you look carefully to the slavery spread map of Lincoln Mullen, you’ll see that New Orleans itself never counted more than 35% of slaves. No, the real reason is migration waves.
Migration crisis and the decline of the city
School desegregation
Money attracts money. During its golden age, the Big easy welcomed many wealthy folks and middle classes, leading to an increase in white demography, peaking up in 1965 (Fig6).

In the sixties, school desegregation happened and Five black kids were introduced into white schools in the lower ninth ward. Responses were immediate, tough, mean. Harmless kids were threatened and insulted every day. Parents start taking their own children off those two schools, it was the « white boycott », mentioned in Steinbeck book « travel with Charly » depicting The USA of the 60’s.
After some time, they felt bad about what was happening, still, they preferred leaving rather than taking part in desegregation. Between 1960 and 1970 the lower ninth ward lost 77% of its white population. They leaked out of the city, so did the money. It was the first migration crisis, the point when the city starts being neglected, and also when the city starts becoming darker and darker, as the lower class ran out of the city slower than the middle and upper one. . . until Katrina.
Katrina
Louisiana regularly faces natural disasters. In 2005, they had to face a huge one: Katrina. Damages were enormous, cost a lot in human lives and dollars, consequences were disastrous for many families, no one will ever contest that, though Katrina is a storm, it has one eye, but no brain. We do. When it had been too often considered as the cause of many troubles, it was in reality only a catalyst.

According to the historical center location and the flood map (Fig7), I think areas sensible to be flooded were known since the first brick was dropped. Poverty, skin colors and flood location match perfectly (Fig7, Fig8, Fig9). Coincidence? I think not.
Katrina had been a real switch in migration tendencies and mark the beginning of the black diaspora. Indeed the damages were mainly ”directed against” lower class habitations. Unable to come back, they went all around, where they had families, friends or jobs opportunities. To date, Houston (TX) is the first relocation place. When owner could not support the rebuilding cost, someone wealthier could. It has been a great time for investors. Gentrification happened hard pushing further back lower classes from the city center.
Since 2005 the city has lost over 100 000 habitants. Interestingly, the poverty rate has not shifted that much after Katrina meaning that middle classes were moving out along with the one who could not be relocated.
Total, the city has lost around half of its weight over 50 years and whereas the first migration crisis was willed, the second one was forced.
”I hope we realize that the people of New Orleans weren’t just abandoned during the Hurricane. They were abandoned long ago – to murder and mayhem in their streets; to substandard schools; to dilapidated housing; to inadequate health care; to a pervasive sense of hopelessness.”
-Senator Obama
Ten years after the catastrophe, the situations has change and the demography start increasing again (+ 13.3% between 2010 and 2015). The city attracts a whole lot of tourist and entrepreneur widening the gap between the one who have and the one who don’t.

Tonino Rizzo-Boyce
New Orleans – Pourquoi cet article
New Orleans – 0. Head and Tail
New Orleans – 1. Unique and beautifull
